Stepping back
11 Jul 2016 - Bruno Prior
Lots of comments about how exchange rates and equity-price movements show that the UK is (a) doomed or (b) well-placed post-Brexit. Movements and values over a few days tell us nothing except the climate of hope or fear in those few days. How do things stand on a broader perspective? Let's compare:
A. Currencies: USD vs GBP vs EUR
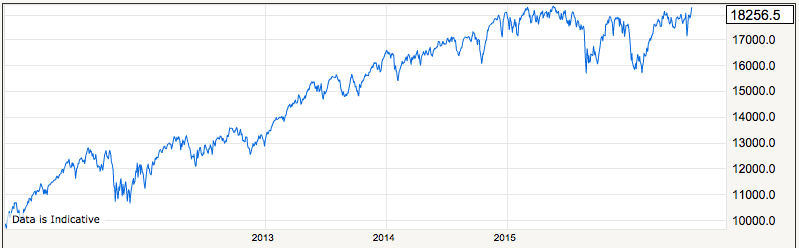
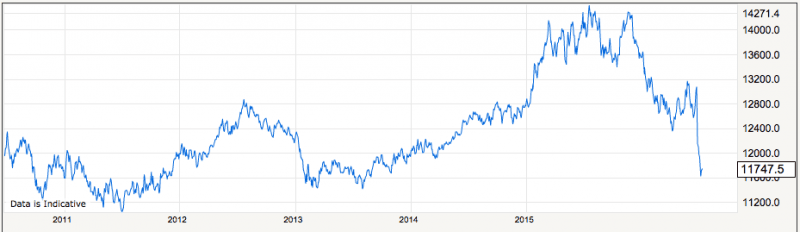
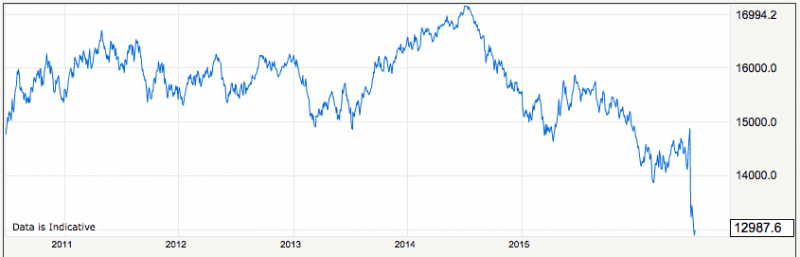
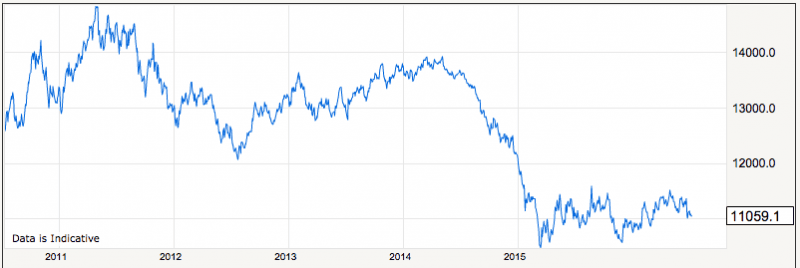
B. Markets: FTSE100 vs FTSE250 vs Dow vs DAX
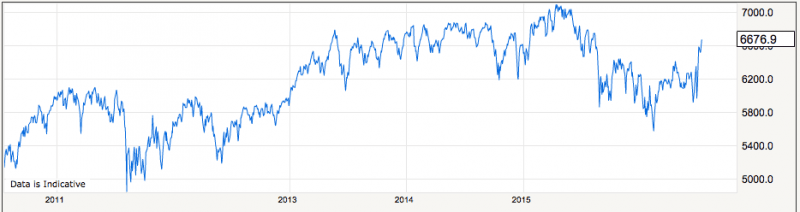
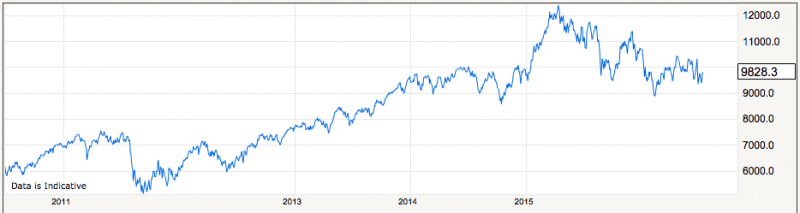
On both currencies and markets, there's not a lot to choose between the UK(FTSE)/GBP and Germany(DAX)/EUR. The currencies are about level. The stockmarket indices have grown slowly over 3 years and strongly over 6. FTSE100 has been the weakest, but as Remainers like to point out, FTSE100 is not strongly connected to the UK economy, depending far more on commodities and exchange rates. FTSE250 and DAX have performed very comparably.
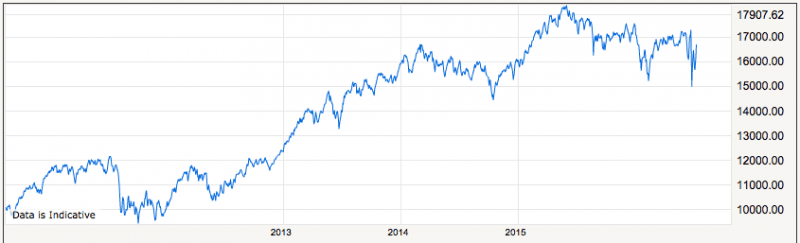
The US(Dow/USD) has been stronger than either the UK or Germany.
Only in the GBP/USD exchange rate has Brexit had a significant impact. The fall in the GBP to the EUR brings it back to the levels it maintained in 2013 and 2010.
There is no obvious cause for fear in the changes in valuations since 23 June, and some cause for optimism that the over-valuation of the GBP against the EUR in 2015 has been over-corrected and should allow for an improvement in the current account deficit and some strengthening of the GBP. That should provide suitable conditions for the UK to continue to attract investment funds
The GBP will probably move back to 1.40 USD and 1.30 EUR (if not 1.35-1.40 EUR, as EUR and USD quite likely move towards parity) once UK politics settles down, the slow process of negotiating Brexit begins in earnest, and focus returns to the many intractable problems on the continent.
A. Currencies
-
GBP to EUR:
Over 3 years: Up 2%
Over 6 years: Down 1.5%
-
GBP to USD
Over 3 years: Down 15%
Over 6 years: Down 14%
-
EUR to USD
Over 3 years: Down 16%
Over 6 years: Down 13%
B. Markets
-
FTSE100
Over 3 years: Up 2%
Over 6 years: Up 28%
-
FTSE250:
Over 3 years: Up 15%
Over 6 years: Up 69%
-
DAX:
Over 3 years: Up 20%
Over 6 years: Up 62%
-
Dow:
Over 3 years: Up 18%
Over 6 years: Up 79%